
Archaeology is usually more associated with shovels and trowels than lasers and drones. But in a recent study of the ruins of Kuelap, at 10,000 feet in the northeastern Peruvian Andes, researchers hardly touched the ground at all.
In August 2018, a team led by Parker VanValkenburgh, an anthropological archaeologist at Brown University, flew a six-rotor drone equipped with a lidar scanner over the site, which was home to up to 3,000 people of the pre-Inca Chachapoya culture roughly 1,000 years ago. Their goal, described in a recent paper, was to understand how the settlement was built and added to over the centuries by creating the most detailed map of the site ever made.
For decades, archaeologists have used lidar scanners mounted on airplanes to discover and map ancient ruins around the world. The sensors’ pulsed lasers can cover far more ground than people on foot, making it easier to detect large-scale patterns in places that are remote or covered with heavy vegetation, or both.

Lately, lidar scanners have become light enough, and drones powerful enough, to combine the two. Drones are less expensive than airplanes, VanValkenburgh says, and flights are much easier to arrange. And since they fly lower and more slowly, drones can capture more detail, including surfaces that are hard to see from high altitudes.
“There’s a misperception that lidar can see through things like vegetation,” he says, “but the laser scan is so dense that it sometimes finds its way between leaves and bounces off ground.”

Keulap is one of Peru’s major archaeological tourist sites, but because of construction, a few security guards were the only other people present during the two days the team flew the drone. VanValkenburgh’s team used a Velodyne puck, a scanner slightly bigger than a can of tuna fish, which uses 16 lasers that pulse 300,000 times per second.
After five flights, the team had a 3D cloud of 164 million data points 5.6 GB in size. But before they could analyze the site’s architecture, including its massive stone walls up to 65 feet high and hundreds of circular structures, the researchers had to clean up the dataset.
The first step was to use an automated progressive morphological filter to distinguish data points that represented large trees and other vegetation. The algorithm used a set of size and height thresholds to separate “ground” points—meaning both structures and the actual ground—from “non-ground” points, meaning everything else. This took care of the highest vegetation.

They continued the cleanup by hand using Cloudcompare, an open source platform for visualizing and processing 3D point clouds. This made it possible to eliminate shorter vegetation and modern construction like wooden handrails and architectural supports, as well as data traces left by the roving guards.
The remaining points were converted into a continuous surface mesh that clearly revealed 421 distinct structures. Using ImageJ, an open source image processing program developed by the National Institutes of Health, they measured the dimensions of each structure, including their “circularity,” or how close a shape is to a perfect circle. The final step was to load everything into the GIS platform ArcMap and use its Hot Spot Analysis tool to see if buildings with similar shapes were grouped together.
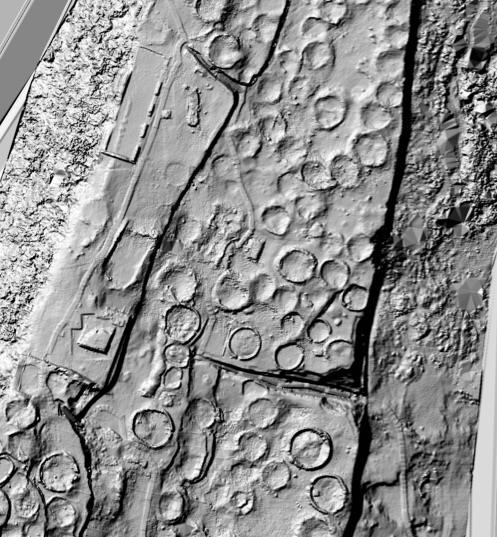
Even though the dataset wasn’t large by lidar standards, it still took a few weeks to process, VanValkenburg says. The final dataset consisted of 130 million data points, or about 175 per square foot. After crunching the numbers, the researchers found a number of “hot spots”—places where buildings with high circularity were clustered—and “cold spots,” or clusters of not-so-circular structures. This suggests that the site started as a small hill-top settlement that was expanded to the south and east to the huge site it is today. The hot and cold spots could represent sections that were built at the same time by the same builders, almost like clusters of houses in a neighborhood.
Archaeologists are just starting to look into using AI to crunch datasets, VanValkenburg says, but he is optimistic that the technology will ultimately have a transformational effect. He and Steve Wernke, an anthropologist at Vanderbilt University, are working on a collaborative geospatial platform called Geocaptcha that lets archaeologists systematically survey satellite imagery over large areas of the Andes. So far. they have covered almost 60,000 square miles and identified over 27,000 sites. They plan to use their results as training data for a neural network to make the process faster and more accurate, Wernke says. “Looking for sites manually is highly effective but time-consuming and pretty monotonous. An AI-assisted approach will enable survey over even larger areas.”

Photos by Parker VanValkenburgh
Julian Smith is a contributing writer.
© 2021 Nutanix, Inc. All rights reserved. For additional legal information, please go here.
Related Articles